New Designs for School
Does School Status Affect Financial Planning?

Scott Milam, Shannon Crotty
Afton Partners
Topics

We’ve all had the experience of truly purposeful, authentic learning and know how valuable it is. Educators are taking the best of what we know about learning, student support, effective instruction, and interpersonal skill-building to completely reimagine schools so that students experience that kind of purposeful learning all day, every day.
Innovative educators around the country are working toward the creation of personalized learning environments in their schools.
Innovative educators around the country are working toward the creation of personalized learning environments in their schools. The path to get there, though, is very different for those building a personalized school from the ground up, and for those converting from a traditional school model.
At Afton Partners, we wondered: how does the approach to launching a personalized learning school before it becomes one (startup vs. conversion) affect its five-year financial plan? How does a school’s status as a startup or conversion school impact expectations for one-time investments and ongoing operating expenses?
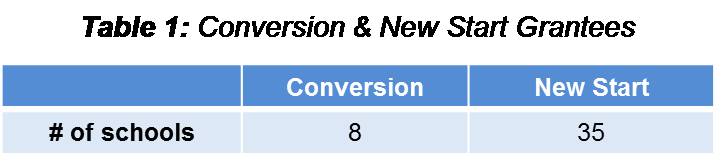
In our second piece for this series, we seek to answer these questions, building on our first post, which discussed innovative instructional staffing at NGLC breakthrough schools. Here, we look at financial plans for 43 breakthrough schools. Eight of these are conversions—redesigned district or charter schools—and 35 are new starts (Table 1).
![]() Among several other critical academic and school design differences, conversions typically launch in their first year at nearly full enrollment, while new starts build their school one grade at a time. We also note that over 80% of the breakthrough schools grant recipients are new starts (we intend to explore this further in a future analysis).
Among several other critical academic and school design differences, conversions typically launch in their first year at nearly full enrollment, while new starts build their school one grade at a time. We also note that over 80% of the breakthrough schools grant recipients are new starts (we intend to explore this further in a future analysis).
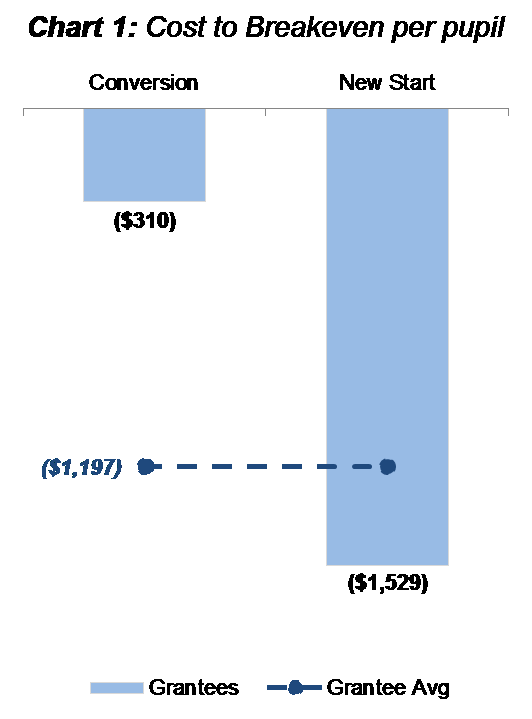
(Unless indicated otherwise, the charts included below use projected year 5 data, and ‘breakeven’ is defined as total investment required before each school generates net income on recurring public funding.) Cost to breakeven is calculated as total expenses in excess of recurring public revenue, divided by enrollment in year 5 of operation.
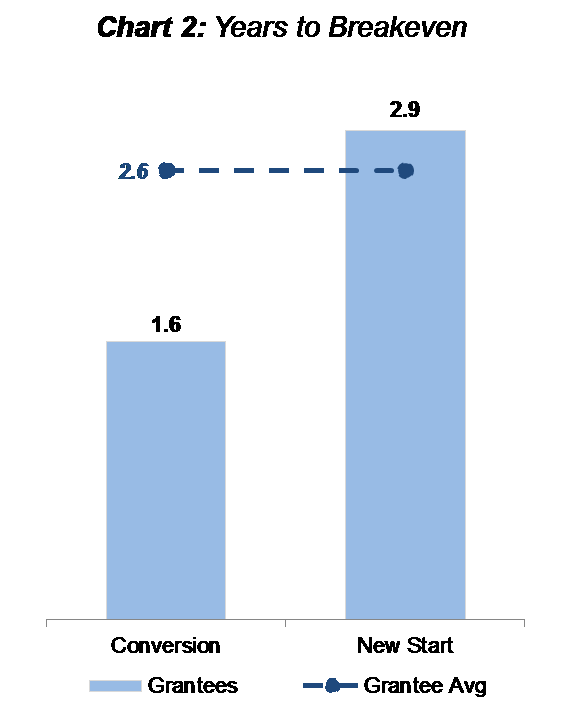
![]() Conversion schools are planning to spend about 80% less per pupil than new starts before they reach breakeven, in almost half the time. New start schools plan to spend an average of $1,529 per pupil to breakeven, compared to $310 per pupil at conversion schools (Chart 1). We also see that, on average, new starts plan to breakeven on recurring public funding in about three years, while conversions plan for about 1.6 years (Chart 2).
Conversion schools are planning to spend about 80% less per pupil than new starts before they reach breakeven, in almost half the time. New start schools plan to spend an average of $1,529 per pupil to breakeven, compared to $310 per pupil at conversion schools (Chart 1). We also see that, on average, new starts plan to breakeven on recurring public funding in about three years, while conversions plan for about 1.6 years (Chart 2).
When we look at total spending by school (Chart 3), conversion schools are also planning to spend less than new starts before they are sustainable on recurring public funding. So, on both a per pupil and gross investment basis, conversions plan to incur fewer one-time costs to achieve breakeven than new starts.

What are conversion schools and their operators planning to do differently?
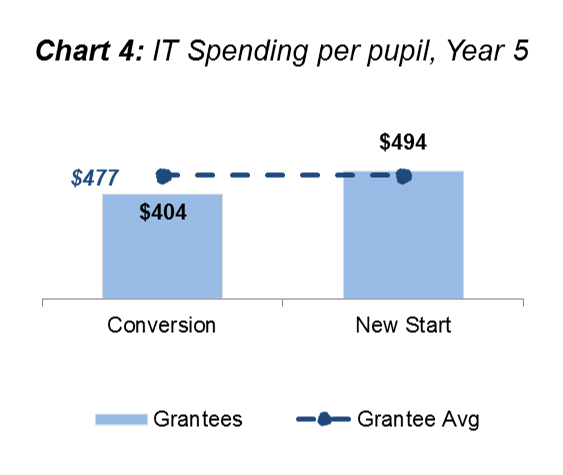
Information Technology (IT) spending is one factor. Conversion schools plan to spend an average of 22% less per pupil than new starts on IT – $404 compared to $494 in year 5 (Chart 4). This may be due to the fact that conversion schools are able to rely upon or repurpose existing IT infrastructure, staff, and equipment.
However, a deeper look at other projected expenses tells another story—one in which new start school plans appear to have a financial advantage.
In certain expense areas, new start school plans actually demonstrate potential cost savings compared to those of conversion schools.
Where and how are they expecting to save money?
Facilities
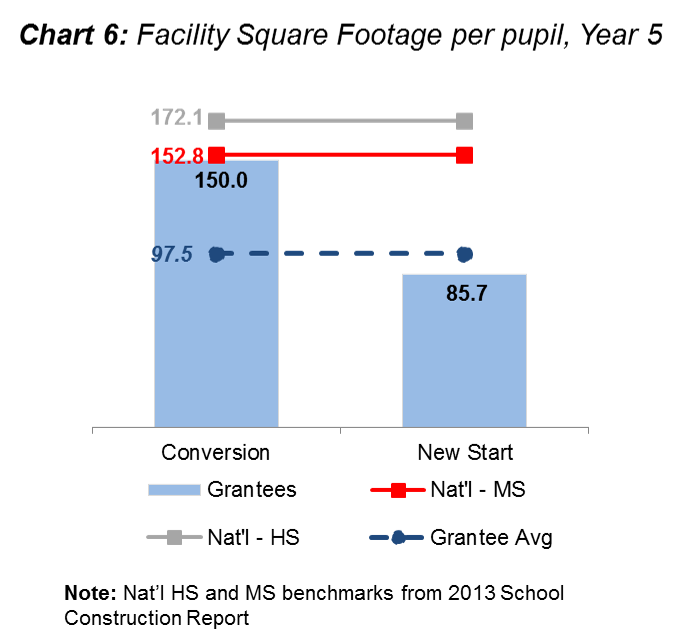
New start school plans include more space per student than conversions, on average, in year 1, primarily due to lower planned enrollment in their launch year. By year 5 (close to full enrollment), however, they plan to use an average of 43% less square footage per student than conversion schools– 86 compared to 150 sq. ft. per pupil (Chart 6).
This indicates that new start schools are planning to use materially less space as they re-think the structural design and need for space in their schools. In fact, new starts are planning to use 40% to 50% less space than schools as they are traditionally built today (also Chart 6).
Human Capital
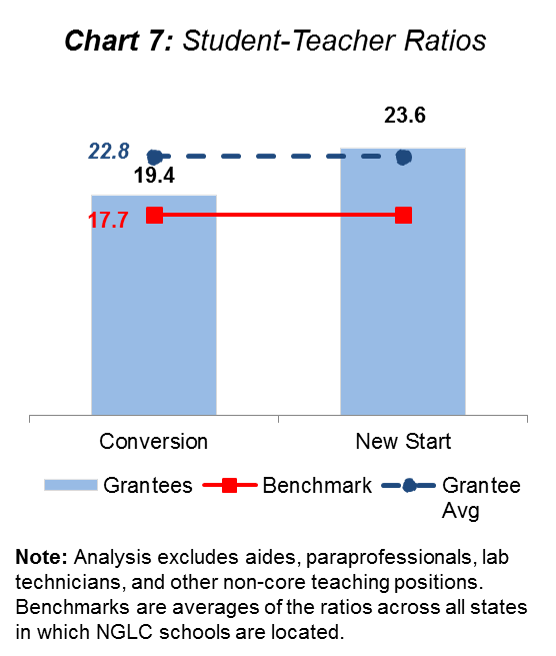
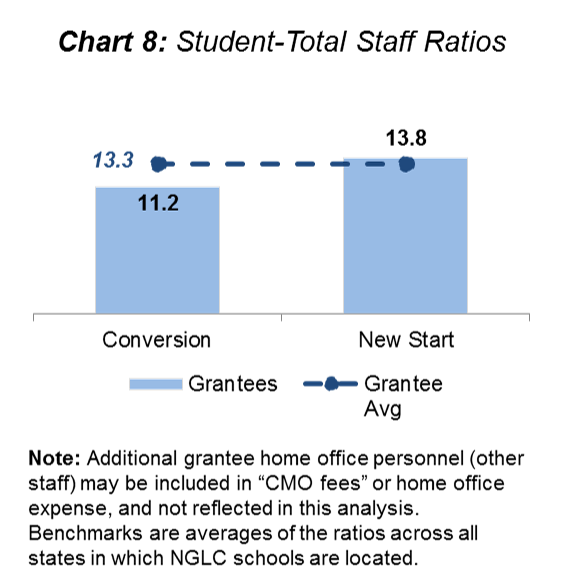
In their fifth year of operations, new start schools are projected to have 17.5% higher student-teacher ratios than conversion schools, on average (Chart 7). Looking at student-total staff ratios, the same trend appears: new start schools plan to have 18.4% fewer staff per student than do conversion schools, on average (Chart 8).
We dug deeper into our analysis of schools’ human capital decisions in last week’s post, Beyond Student-Teacher Ratios: How Breakthrough Schools Invest in Human Capital.
Conversion and new start schools plan to use resources in several different ways:
- Converting schools plan to spend less per pupil to breakeven and in less time
- New starts plan to use less space per pupil and have lower student-staff ratios by year 5.
- New starts expect to invest more one-time funds on their schools (per pupil and by school).
- New starts are also planning to have larger class sizes and smaller facilities than traditional schools.
In summary, new starts incur higher initial costs to launch, but may cost less to operate at full enrollment, while conversion schools require lower one-time costs, but may not cost less to operate over time.
Over time, we’d like to see this analysis mapped to actual financial and academic results to identify the most successful models to emulate or leverage as operators consider effective models to scale. The success of these conversion models will be particularly interesting for district schools that may have less financial and operating flexibility, but are still looking to adopt breakthrough personalized learning school designs for their students.
![]() What do you think? Do you agree with our key takeaways from the data above? What else do you find interesting or innovative? We’d love to hear from you, especially those who may have experience working to implement personalized learning school models.
What do you think? Do you agree with our key takeaways from the data above? What else do you find interesting or innovative? We’d love to hear from you, especially those who may have experience working to implement personalized learning school models.
Scott Milam, Shannon Crotty
Afton Partners
Scott Milam is the co-founder and managing director at Afton Partners, which works to identify and promote financial practices, policies, and strategies that inform and optimize the implementation of effective strategies for student achievement. Shannon Crotty is Afton Partners’ knowledge management associate. Scott is based in Washington, DC, and Shannon in Chicago.