Beyond Student-Teacher Ratios: How Breakthrough Schools Invest in Human Capital
Topics

We’ve all had the experience of truly purposeful, authentic learning and know how valuable it is. Educators are taking the best of what we know about learning, student support, effective instruction, and interpersonal skill-building to completely reimagine schools so that students experience that kind of purposeful learning all day, every day.
How do personalized learning schools plan to use human capital resources?
This series of blog posts will explore trends and raise questions to explore as NGLC breakthrough model schools gain additional experience launching, and ultimately iterating, their models.
Over the past two years, 44 K-12 school operators from a competitive pool of nationwide applicants received NGLC launch grants. As part of the grant program, NGLC began working with Afton Partners in order to document lessons learned, to develop financial plans that are sustainable on recurring public funding, and to create an initial set of data analyzing resource allocation and the trade-off decisions inherent in any staffing scenario.
Some interesting trends have emerged from the first set of business plans—and this series will incorporate these plans along with the final round of applications from spring 2014. Keep in mind, also, that this analysis is based on schools’ plans at full enrollment. We continue to partner with the Center for Reinventing Public Education (CRPE) to analyze actual results over the coming months—be on the lookout for a final report anticipated in early 2015. (If you can’t wait that long, outcomes from a very preliminary view of schools launched in 2012 are included here.)
Breakthrough Staffing
A few key components of the schools’ financial plans revealed alternative approaches to staffing. Anecdotally, breakthrough school plans have not fit into any singular mold, including many unique instructional staffing approaches that may look quite different from those in traditional schools.
Here are a few examples:
- Learning coaches providing one-to-one support to students across two classrooms (Alpha Public Schools)
- Employing Relationship Managers, Relevance Managers, Rigor Managers, and Success Coaches in place of traditional teachers (Cornerstone Charter Schools)
- Grouping teachers with cohorts of students across grade-level bands for extended time with a given teacher (Ingenuity Prep)
Educational staffing is an evolving landscape; some school operators’ alternative approaches to human capital are introducing new roles in the classroom. Ultimately, such changes will serve to shape students’ learning experiences.
We developed an instructional staffing analysis which compares staffing plans (by position) to student enrollment in each school’s projected fifth year of operation. To do the analysis, we put the schools into three groups (called “Tertiles”) based on recurring public per pupil revenue—financial support that schools can count on year after year, based upon their student population.
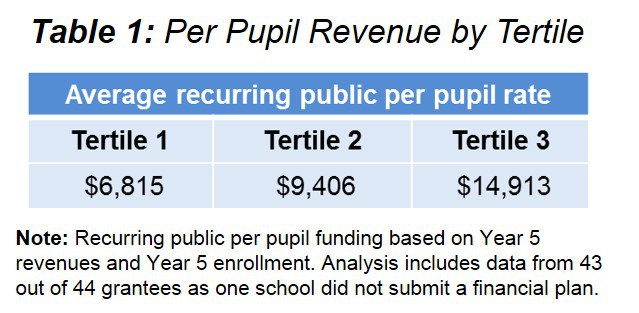
We then compared the groups (called “Tertiles”) on their student-teacher ratios and student-instructional staff ratios.
Schools consistently project higher than traditional student-teacher ratios. Most grantees, regardless of funding level, projected higher student-teacher ratios than existing schools operating in their respective states (Chart 1). Additionally, the student-teacher ratios in lower funded schools are approximately 12% greater than those of higher funded schools (21.5 compared to 24).

However, schools with more public funding invested in additional classroom staff. Schools’ plans for instructional staffing varied based on per pupil funding levels (Chart 2). Schools with higher funding levels plan to hire more instructional staff, driven primarily by increasing non-teacher instructional staff. This includes aides, paraprofessionals, lab technicians, tutors, hourly staff, and other non-core teaching positions.
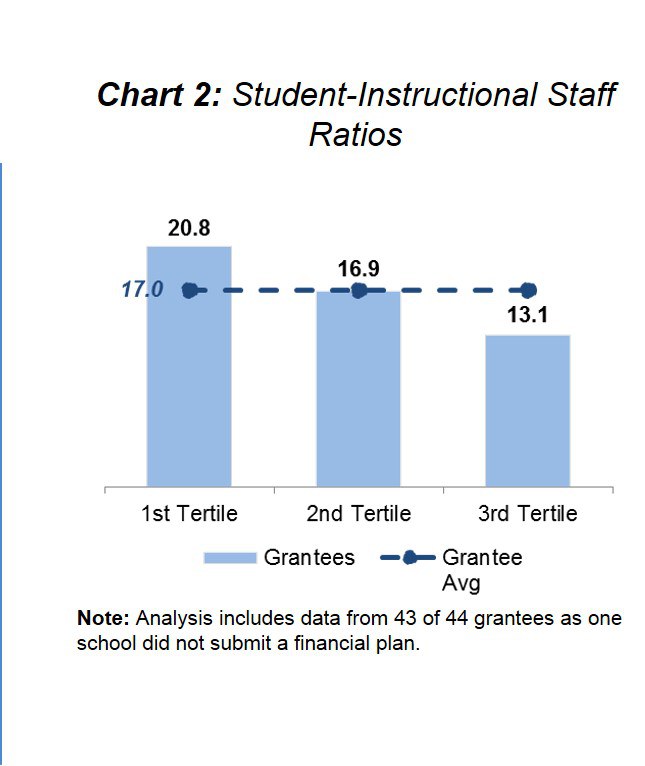
Notably, 66% of schools in the lowest funded group (the first tertile) plan to use non-teacher instructional staff, compared to 92% in the second tertile, and 93% in the third tertile. To put it plainly: the student-instructional staff ratios in schools with lower funding are approximately 59% greater than those of higher funded schools (20.8 compared to 13.1).
The bottom line: A correlation seems to be developing between funding levels and the number of non-teacher instructional staff in the classroom. (Though student-teacher ratios reflected a 12% variance between lower and higher funded schools, student-instructional staff ratios reflected nearly a 60% variance in the same schools.)
What do you think? What does this mean for students and the learning that happens in these schools? What else do you find interesting or innovative? We’d love to hear from you, especially those who may have experience in implementing personalized learning school models.


