New Designs for School
Evidence of Personalized Learning Practices in NGLC Schools
Topics

We’ve all had the experience of truly purposeful, authentic learning and know how valuable it is. Educators are taking the best of what we know about learning, student support, effective instruction, and interpersonal skill-building to completely reimagine schools so that students experience that kind of purposeful learning all day, every day.
There’s so much more within RAND’s Early Progress: Interim Research on Personalized Learning than students’ MAP scores.
Earlier this month, I shared my take on the key findings of student achievement in the RAND Corporation’s study of 23 personalized learning schools. To boil it down, the early results are “promising.”
The study found widespread growth in math and reading scores across schools bringing students above or near the national average on MAP.
But there’s so much more within Early Progress: Interim Research on Personalized Learning than students’ MAP scores. Here is a summary of what RAND observed about the school design characteristics.
School Design Characteristics
RAND’s observations of the schools’ design characteristics are a check on NGLC’s grant selection process where we can see, in general, how aligned implementations are with what school developers proposed and planned for. (Note, not all schools in the study were funded by NGLC. The study also includes the Charter School Growth Fund’s Next Generation School Investments and the Gates Foundation’s Personalized Learning Pilots.)
RAND found substantial variation in the school models. We funded schools with bold and unique academic models. Check.
However, each of the schools implemented one or more common personalized learning practices: learner profiles, personal learning paths, competency-based progression, and flexible learning environments. NGLC expected schools to adhere to a set of principles which includes these four practices, as currently expressed in the Personalized Learning School Design Attributes. Check.
Schools are adopting these practices within a systemic redesign of how teachers teach, how students learn, how teachers and students interact, how time is used, and how physical space is structured. NGLC funded coherent whole school models, not smaller programs or selected innovations. Check.
Teacher Practices
RAND offered four specific findings about teacher practices, and I’d like to shed more light on these findings by offering some additional information about each of the practices for you to consider:
- Teachers reported widespread use of competency-based instructional practices. See the blog post, Competency-Based Learning in K-12 Schools, to learn how NGLC schools set boundaries for self-pacing and how they integrate competency-based learning with project-based learning, next gen staffing, and other innovations.
- Nearly two-thirds of teachers reported using learner profiles and personalized learning plans. In Lighting the Path to Personalized Learning, Getting Smart authors share narrative stories of how Summit Denali, Brooklyn Lab, and Florida Virtual School are using these practices to create personalized learning for all students.
- Technology is used extensively, but use varied widely even within the same school. Early findings from CRPE’s financial study of NGLC-funded schools identified that the eight schools in their study tended to cut their technology budgets to cover first-year revenue shortfalls. This finding of extensive albeit inconsistent use of technology suggests the schools’ budget decisions may not be substantially impacting teachers’ ability to use tech in their instruction.
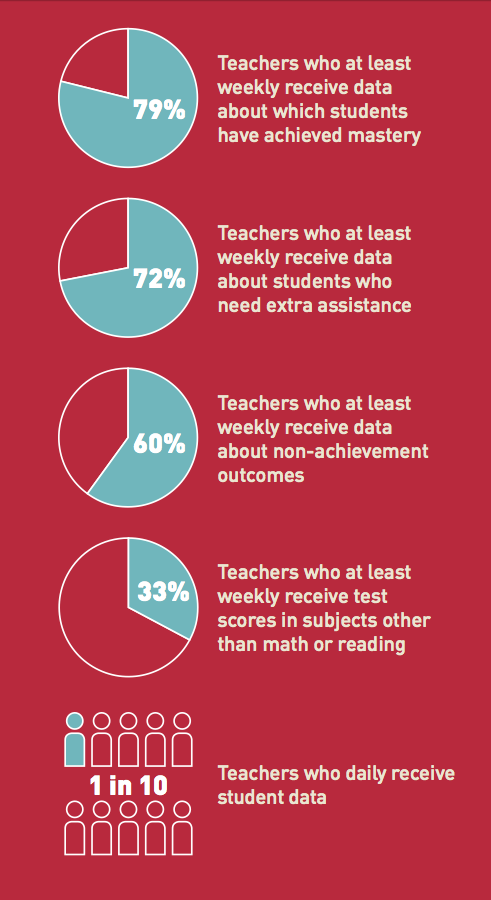
- Teachers used student data frequently and have relatively high levels of satisfaction with data systems, as shown in the graphic below copied from p. 13 of the report. We know that getting student data in a form that teachers can use is a challenging task. Some NGLC-funded schools are not finding commercial or open-source ed tech products that fit their unique models. Either these schools are spending hours upon hours manually pasting together dashboards or they are creating their own tools. See Matchbook Learning’s Spark as one example of a homegrown data integration tool.


